APPLIED URBAN SAFETY ANALYTICS / RESEARCH RELEASE 1.0
CRASH TEST
Spatiotemporal Traffic Collision Risk Forecasting
Research overview
CRASH TEST is a reproducible platform for weekly collision-risk forecasting across San Diego Police beats. It asks whether aggregate report history can improve next-week count and relative-risk ranking over transparent seasonal baselines. The work is not individual-crash prediction or a street-level safety map.
Problem definition
The unit is a San Diego Police beat and Monday-starting week. The primary target is the following week’s report count; a secondary target is whether any report occurs. Evaluation includes count error, calibrated occurrence probability, and relative-risk ranking rather than an unsupported claim of exact-location prediction.
Data sources and preprocessing
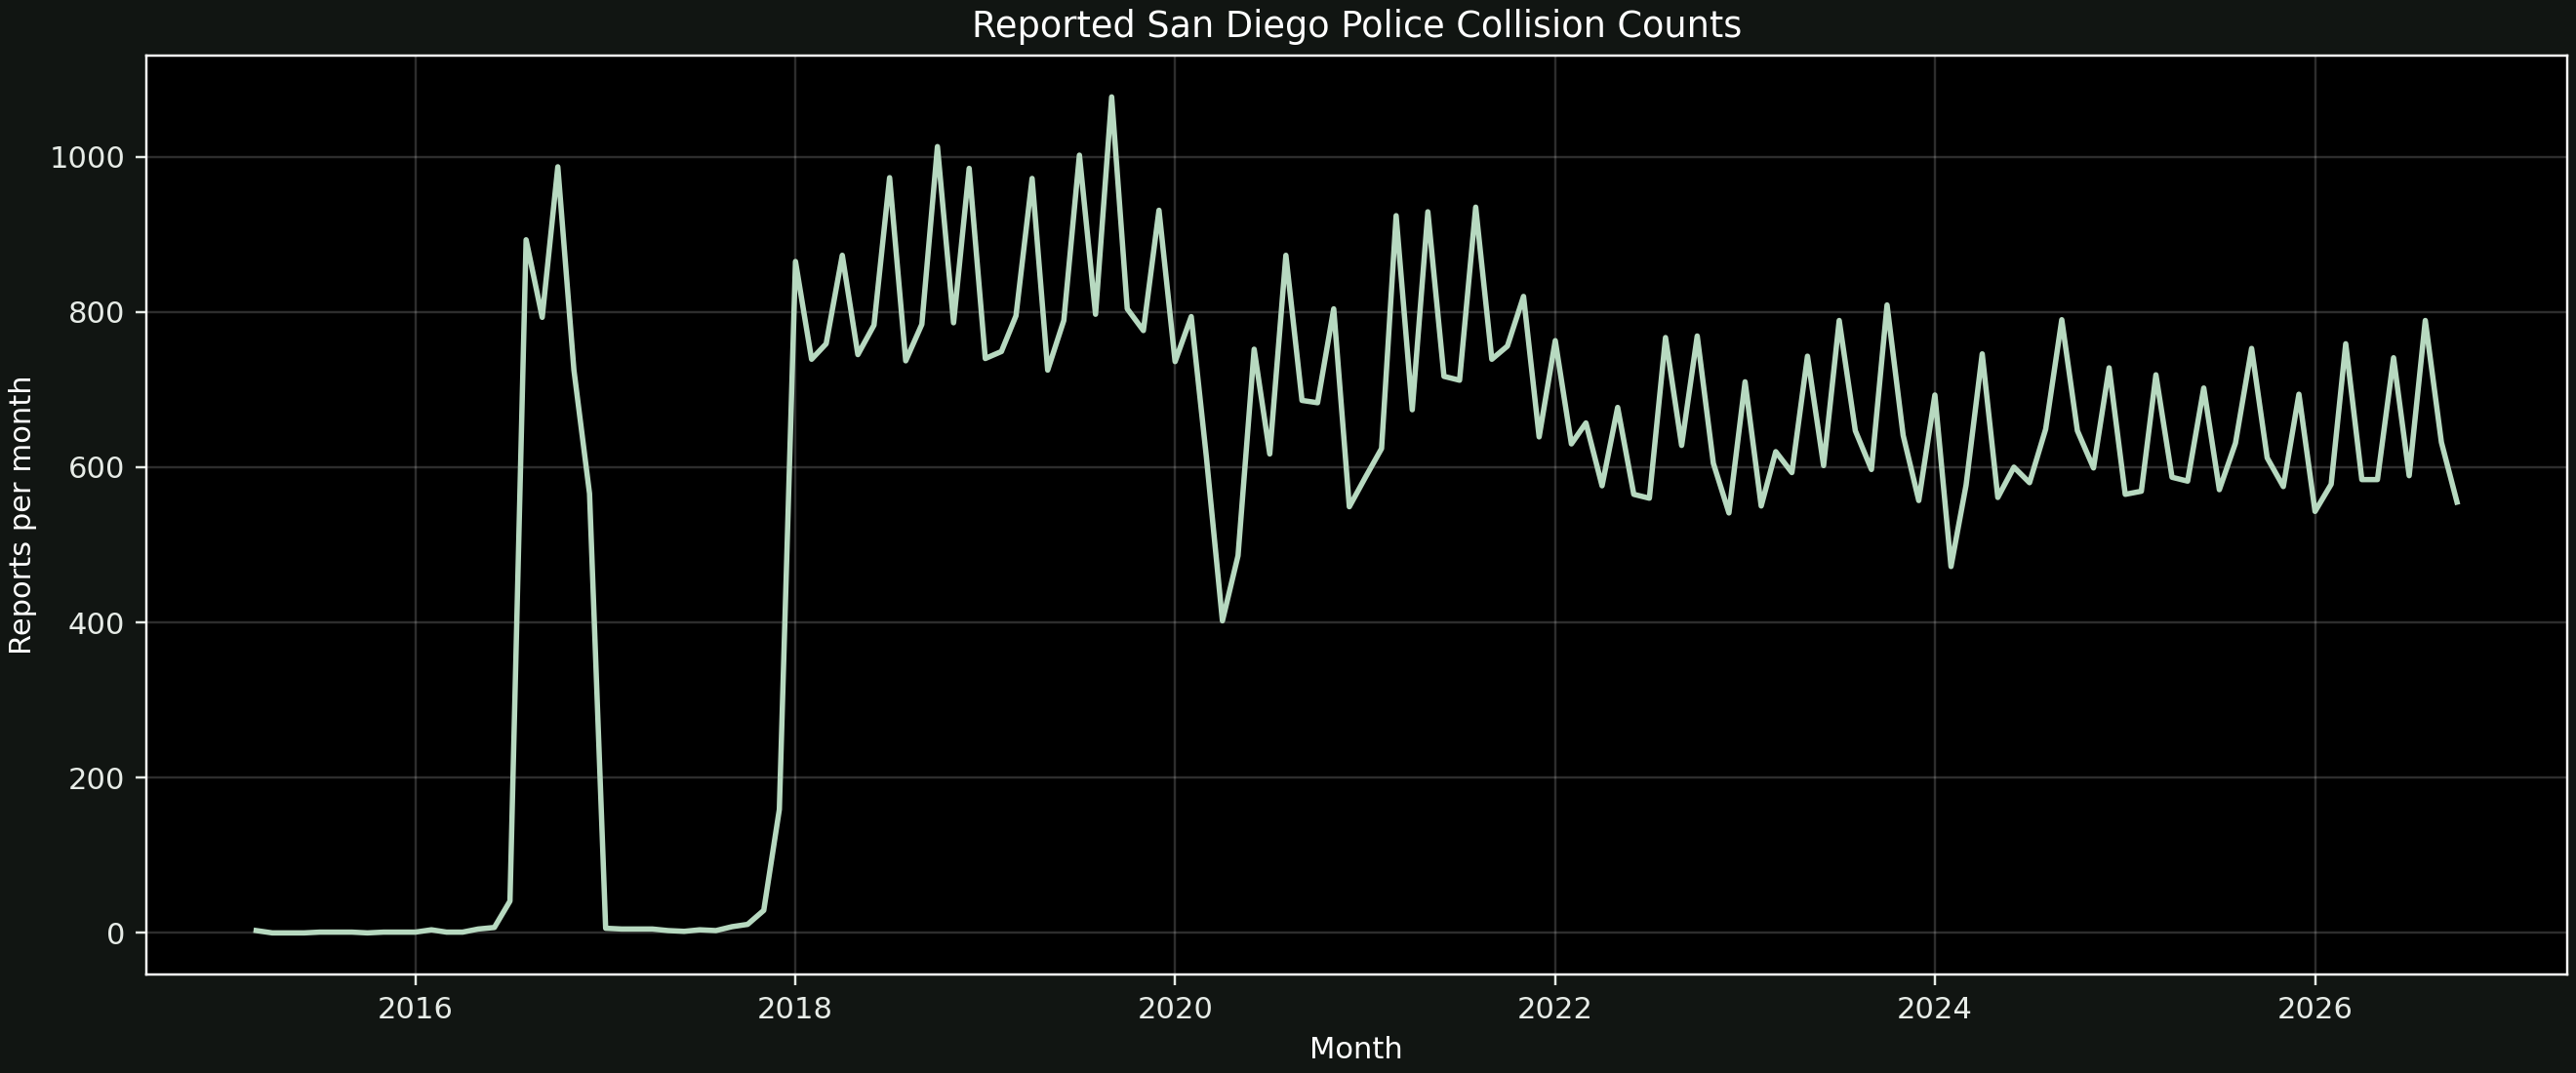
The primary City of San Diego Police basic-report snapshot contains 78,715 deduplicated report IDs across 148 beats, from 2015-03-19 through 2026-11-06. Invalid dates or beats are excluded, and a source checksum, missingness summary, and schema are saved locally. The source has block-level address components but no verified latitude/longitude, so it cannot support a genuine point-level collision map. Selected ADT counts are cataloged but not merged without a validated beat-to-roadway crosswalk.
Feature engineering
Features contain one-, two-, four-, eight-, twelve-, and fifty-two-week count lags; shifted trailing count, injury, fatality, and hit-and-run summaries; police-beat identity; and cyclical week-of-year terms. Every historical feature is shifted before the forecast week. This prevents future collision information from entering its own prediction.
Forecasting methodology
Seasonal-naive and Poisson-regression baselines are compared with histogram gradient boosting under a Poisson loss. The occurrence classifier is independently calibrated with logistic calibration. Model complexity is justified by held-out comparison; no neural model is included because the available aggregate data does not establish a need for one.
Model training and evaluation
Training uses observations through 2023, validation uses 2024, and the reported test window is the untouched 2025 calendar year. Two rolling-origin evaluations score 2023 and 2024 after their respective training cutoffs. A deterministic disjoint 20% police-beat split tests transfer to unseen administrative areas.
Results
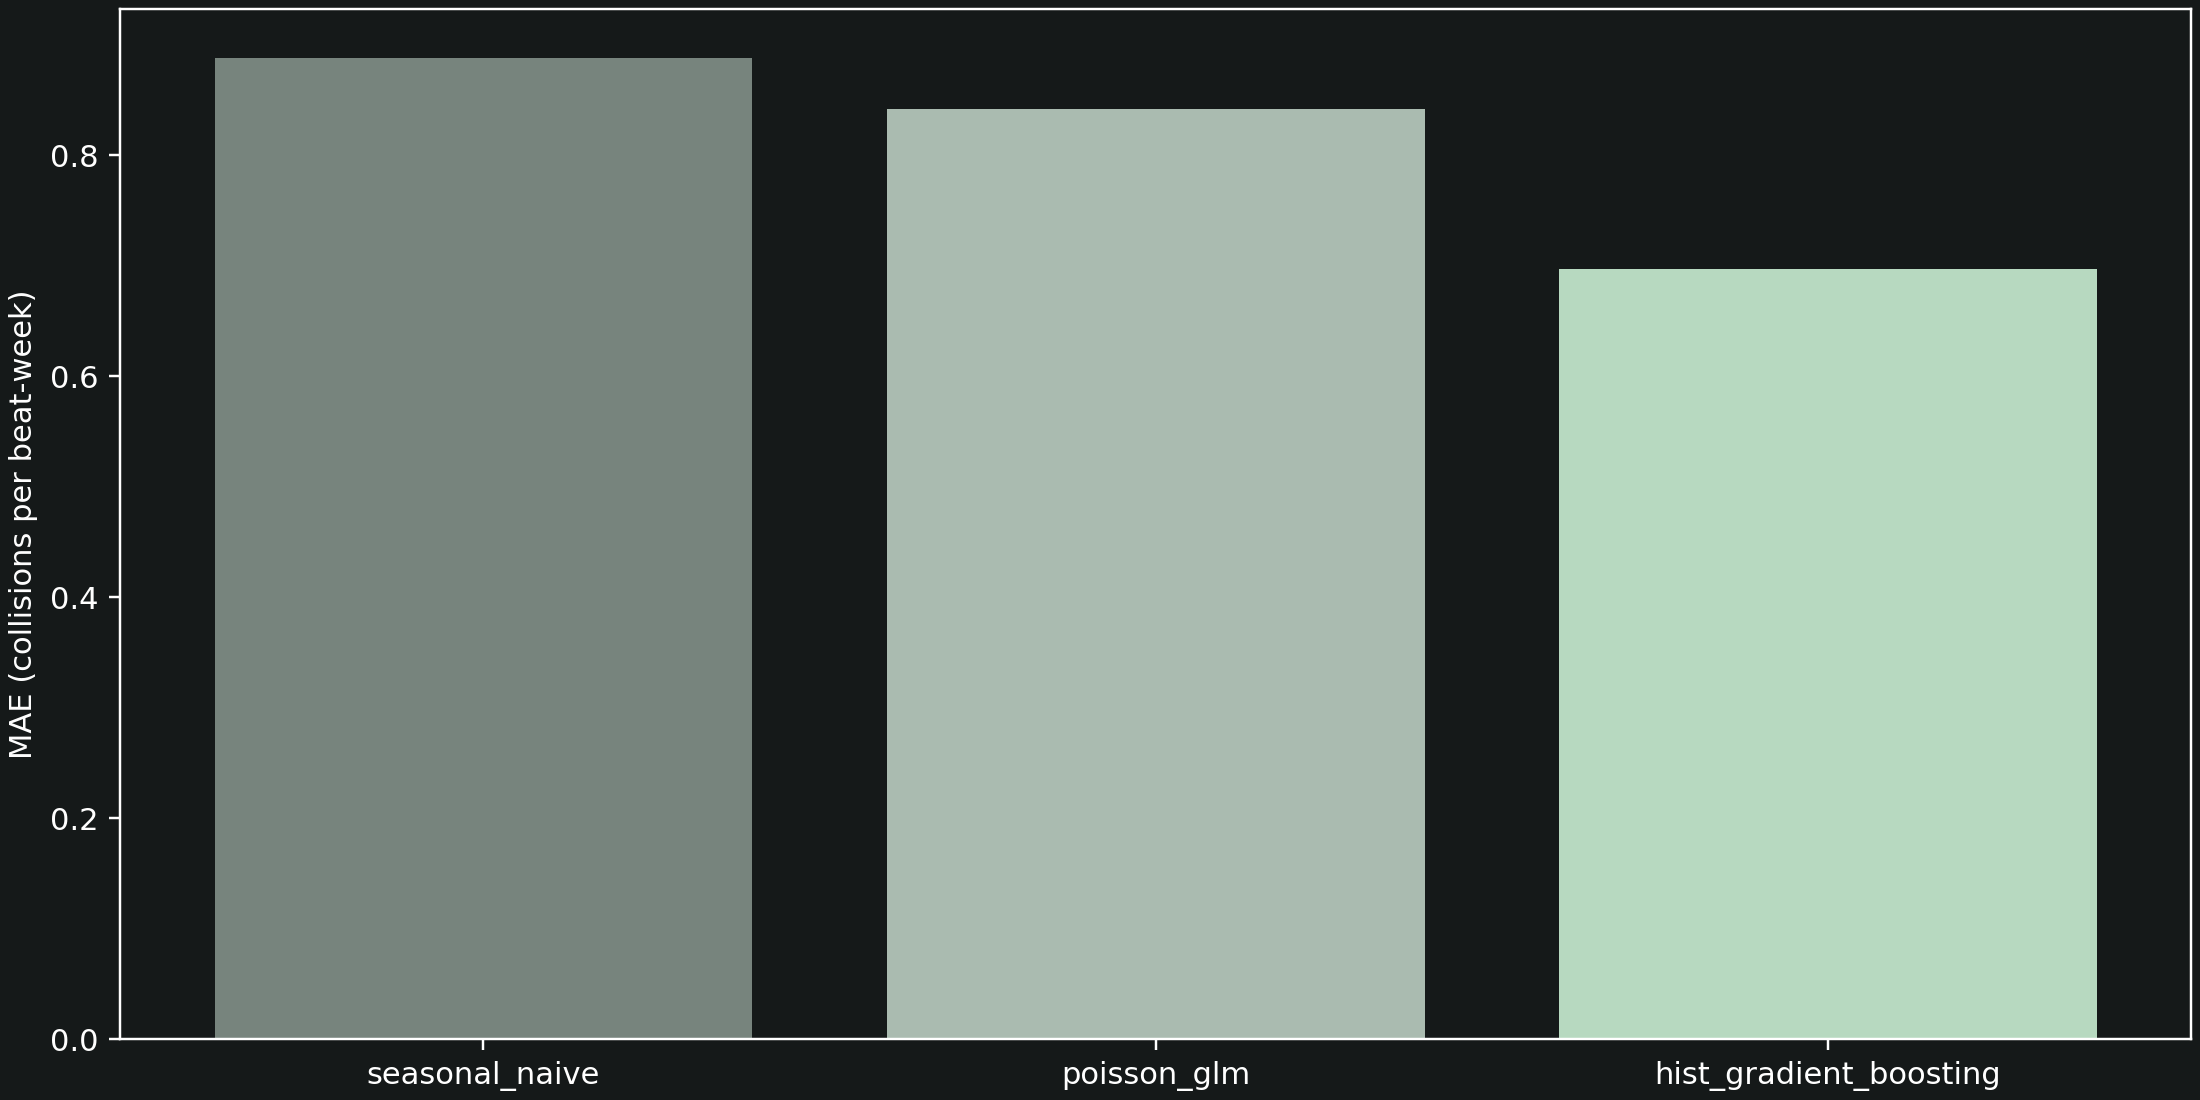
On 7,696 held-out 2025 beat-weeks, gradient boosting achieved MAE 0.697, versus 0.842 for Poisson regression and 0.888 for seasonal naive. The top-decile risk ranking recalled 56.1% of the observed top-decile rows and had 3.587x lift. Those values are read directly from saved predictions and summary artifacts.
Prediction uncertainty
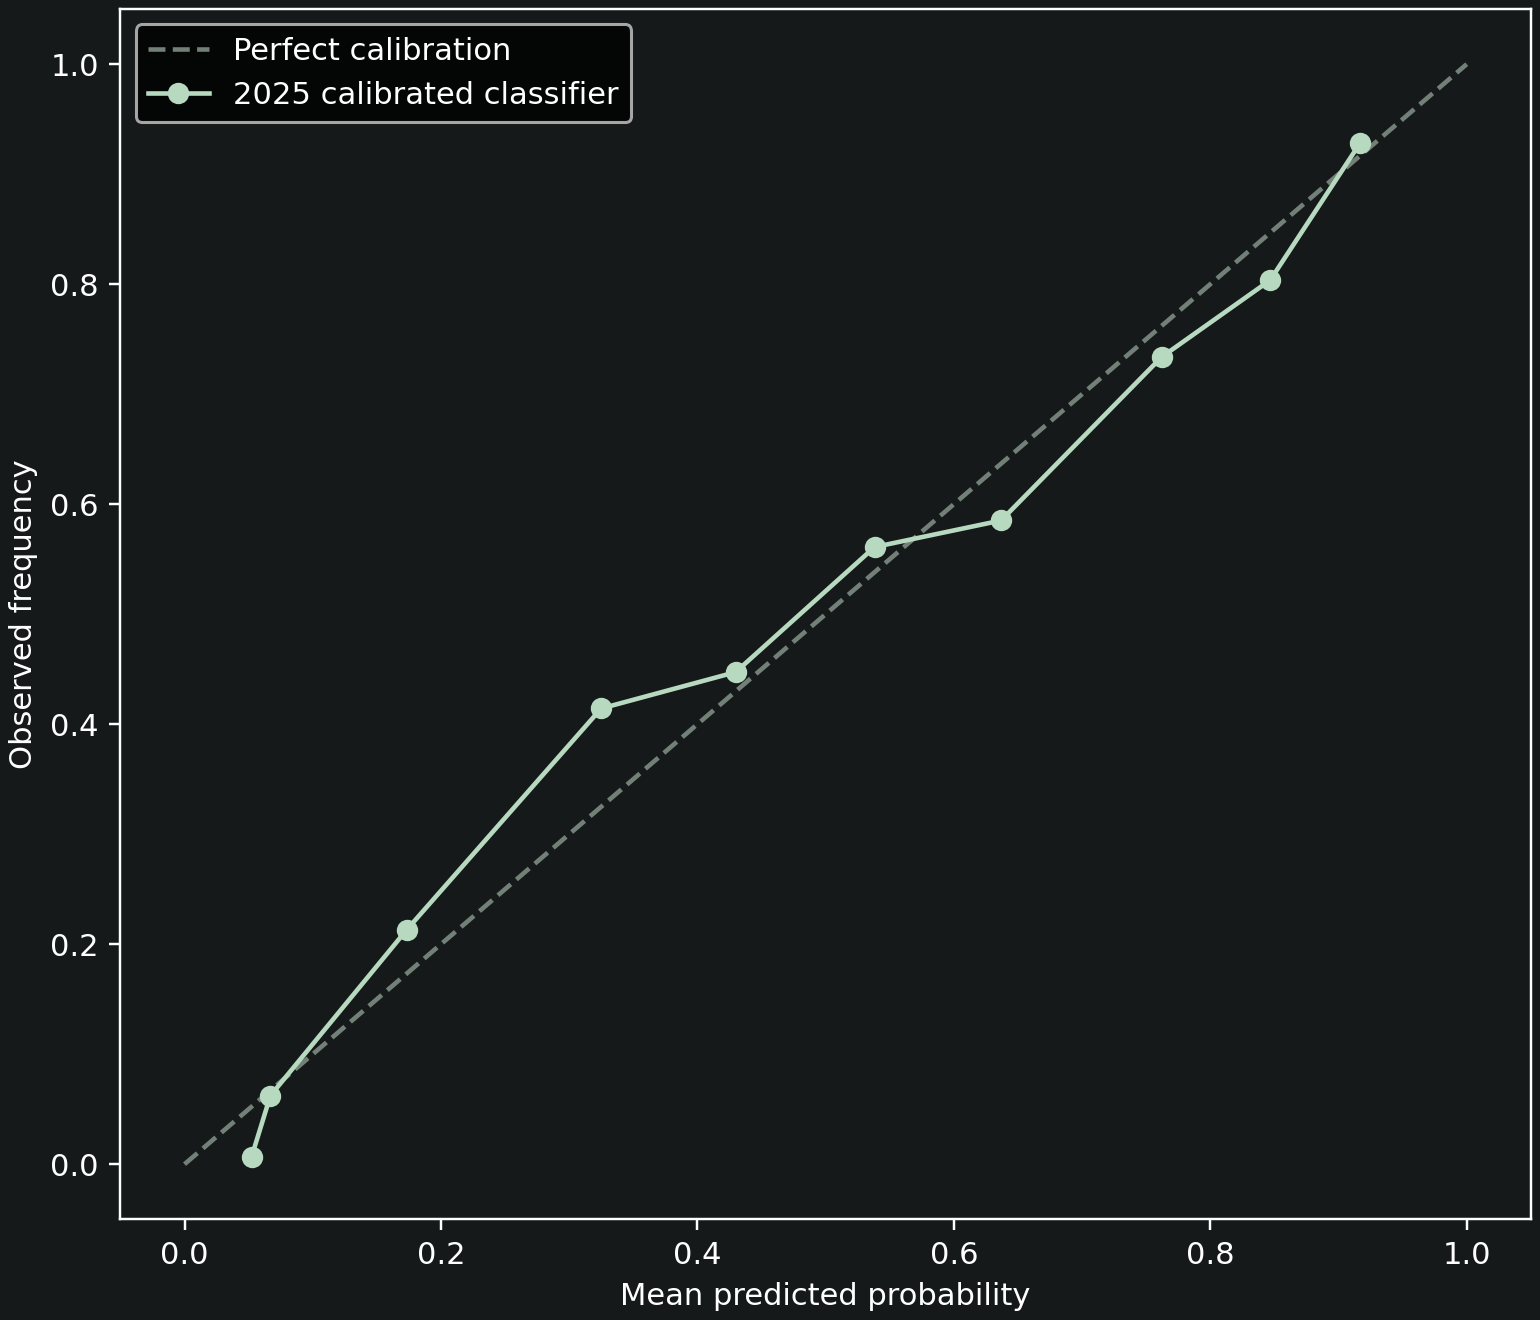
Occurrence probabilities are calibrated on 2024 only, then evaluated in 2025: PR-AUC 0.814 and Brier score 0.164. A nonparametric bootstrap estimates the MAE improvement over seasonal naive at 0.190, with a 95% interval of 0.170 to 0.210. No conformal interval or count-distribution guarantee is claimed in this release.
Model interpretation
Held-out permutation importance measures the change in count error when a feature is shuffled. It is a diagnostic of predictive reliance, not causal attribution; correlated historical lags can share or mask importance.
Limitations
Police reporting, traffic exposure, enforcement, and data quality vary geographically and over time. Many property-damage-only incidents are not represented, freeway incidents may be handled by CHP, and police beats are administrative boundaries. No verified point coordinates or defensible traffic-exposure crosswalk are currently available. The results are unsuitable for individual decisions, insurance pricing, or enforcement allocation.
Conclusions
The study demonstrates that leakage-safe historical features materially improve aggregate 2025 beat-week collision-count forecasting over the evaluated seasonal baseline. It does not demonstrate causal risk drivers, point-level prediction, or readiness for operational allocation. Future work requires verified boundaries, an exposure crosswalk, and a separately governed use case.
Reproducibility
Download the documented official source CSV, install the Python dependencies, run the baseline and expanded experiment scripts, then serve the read-only API and dashboard. Raw source files, row-level derivatives, and model binaries are excluded from version control; generated provenance records preserve checksums, coverage, schema, and experiment artifacts.